|
Shanghai International Shipping Institute issued its Global Port Development Report (2015) on March 29, 2016, pointing out that the global port growth curve in 2015 presented an “arc top”, registering a growth rate of only around 1%. Negative growth plagued many major ports in terms of cargo and container throughputs. Even with the slump in international coal, ore and oil prices, the seaborne transportation volume of large bulk cargoes only managed to maintain positive growth.
Global port throughput growth slows down significantly. In 2015, the global economy and trade were shadowed under huge pressure. Coupled with the fluctuating financial market and increasingly aggravated geopolitical risks, emerging market ports nearly fell into stalemate. In 2015, the cargo throughput growth of major ports in the world tumbled to 1.2% from the 5.1% in 2014. To be specific, the port throughput growth in the first three quarters remained at around 2%, and, at the end of the year, the trade volume suffered a “plunge” because of the ante-displacement of demand, while the quarterly throughput of major global ports sank into a vortex of negative growth for the first time in recent years.
Ports in different regions take turns to welcome throughput growth with the Asian and Australian markets in downturn. Because of low fuel prices, low interest rates and quantitative easing, European ports managed to maintain a mild recovery momentum. Coupled with the weak demand of the external market, major ports in Europe maintained an annual growth rate at 2.7%, a slight increase compared with 2014. US ports, on the other hand, registered an increase of around 3% as a result of growing local business investment and energy consumption. However, the uncertainty in its political and financial environments injected unstable elements into its port cargo volume growth, as evidenced by the obvious seasonal volatility of its port development over the year. Major ports in Asia only registered less than 1% in 2015, a sharp decrease of nearly 4 points from the level in 2014. The growing momentum in the Asian emerging market has slowed down quite markedly. In particular, some excluding international economy and trade agreements discouraged trade growth demand in Asia to some extent. Australian ports were hit hard by the reduced demand in ore, coal and other large bulk cargoes and the growth was extensively diminished to nearly zero. It is noteworthy that African ports gradually revealed their economy and trade potential and became the only region enjoying accelerated growth in 2015 because of enhanced investment in infrastructure.
China’s ports see slowed down production activities. In 2015, the throughput of China’s ports at a designated scale or above reached 11.4 billion tons, increasing by 1.8% year on year – a decline of 3 percentage points over the 4.8% of increase in 2014. In the first half of the year, production activities at ports began to show signs of recession because of the constantly reduced domestic investment and consumption drive. Furthermore, the import and export trade receded and the growth impetus of throughput moved to domestic trade. In the second half of the year, the growth rate of containers for domestic trade at China’s ports gradually slowed down, further crippling the port development growth.
Table
1 Global Top
20 Ports by Cargo Throughput (2015)
(Unit:Millon
Ton)
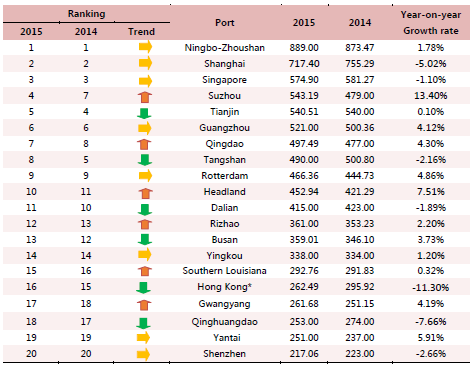
Source: Websites of Various Port Authorities, Ministry of Transport of People’s Republic of China.
Container throughput growth at global ports falls season after season. In 2015, the growth of global seaborne transportation demand for commodity trade was sluggish. The container volume growth at various ports all witnessed declines by varied degrees compared with 2014 and European ports even slipped into the negative growth mire again. Apart from the world economy and consumption market malaise, the international trade sanctions, protectionism and imperfect international trade agreements all generated an adverse effect on the growth of the global container trade. Since Q1, the growth of container throughput at global ports continued to fall. The growth was less than 1% when it came to Q3. Region-specific, the container volume growth in Asia fell to 2.0% from the 6.0% in 2014; in US markets, despite the diminished increase, regional trade boosted the container volume, enabling it to rise by 2.9%. European ports were influenced by the Ukrainian crisis, Greek debt crisis, the refugee crisis and terrorist attacks. The regional trade and port cargo volume growth were impaired, with the container volume decrease of major ports hitting more than 3%.
Table 2 Global Top 20 Ports by Container Throughput (2015)
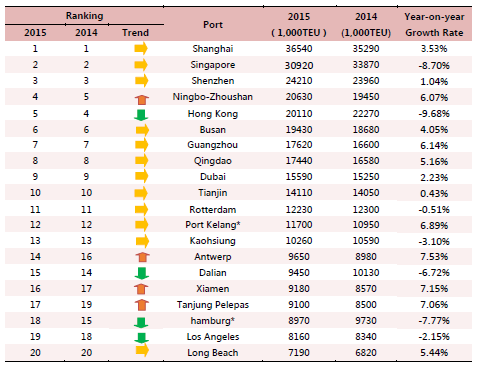
Source: Websites of Various Port Authorities
Growth of dry bulk cargo throughput at global ports not as expected. In 2015, although the coal and ore prices continued downward turbulence, international dry bulk cargo trade demand remained sluggish with no improvement in the oversupply in the market. As a result, the growth of dry bulk cargo throughput at global ports weakened. Ore-wise, the demand from emerging countries represented by China eased. China’s iron ore imports in 2015 only saw an increase of 2.3% year-on-year and Ningbo-Zhoushan and Rizhao ports even suffered negative growth. In addition, iron ore demand from Japan, South Korea and European regions also declined a little. The above led to the plunge of ore shipment growth from Australian ports etc. Coal-wise, the coal transportation demand at ports also shrank sharply as a result of the extended clean energy application and increasingly rising environmental protection calls. In 2015, the accumulated coal exports from Australia registered only 227 million tons, down 3.4% against that in 2014, and the growth at major shipment ports such as the Port of Hay Point was limited. China, an import giant, however, only imported 204 million tons of coal during the year, a decrease of more than 30%. To be specific, the decrease rates of Shanghai port, Ningbo-Zhoushan port, Tangshan port and Huanghua port were 22.6%, 16.0%, 17.3% and 13.2% respectively.
Throughput of liquid bulk cargo at global ports grow in a stable fashion. With the ever increasing shale oil yield in the US, China’s dependency on external petroleum supplies is on the rise and its trade volume and port throughput of liquid bulk cargoes, primarily oil products, basically maintained stable growth. In particular, the oil cargo throughput at Singapore port fluctuated upward, with the annual year-on-year growth more than 7.3%, nearly seven percentage points higher than the growth rate of the previous year. The oil cargo volume handled at South Korean ports in 2015 enjoyed an increase of 4.9% over the year 2014, while China’s accumulated crude oil imports increased by 8.8% year-on-year. Among China’s major loading and unloading ports, Dalian Port boasted a year-on-year growth rate of more than 30% with Qingdao port and Tianjin port experiencing 5.3% and 3.9% respectively.
Throughput growth at global ports expected to
encounter bottleneck in 2016. The year 2016 will
become an important window phase to reveal the inflection point of the world
port growth rate. After the outbreak of the financial crisis in 2008, the
growth of world trade and global ports entered a “slow track” of around 5%.
Thanks to the stimulating monetary and financial policies of various countries,
the trades of large cargoes and containers maintained a mild increase. However,
the demand from emerging countries, an important prop for international
seaborne transportation trade, eased because of the slowed economy growth. The
increasing political uncertainties between North Korea and South Korea and in
the Southeast Asia and Middle East regions, as well as the failed consensus of
international trade agreements in a global context, greatly compromised the
expected growth in the international seaborne transportation market. It is
estimated that the turning point of growth rate for major global ports will emerge
in 2016 and the challenge of zero growth will stand in its the way.
Global
container volume keeps rising in 2016, but with a feeble growth momentum for
bulk cargoes. Although the global container
throughput in 2015 enjoyed an increase, the growth rate has fallen to around
1%, underperforming that in 2014 obviously. When the global economy and trade
situation tends to stabilize, and the international bilateral and multilateral
cooperation tends to get closer, the seaborne transportation costs will be
further reduced with the low international oil prices. This will benefit the
improvement of international commodity trading and boost the development of the
container trade. It is estimated that the container throughput growth of global
ports in 2016 is expected to stay securely above 3%. In addition, emerging
market economics are under the pressure of economic transformation, with the
investment-driven economy mode hard to sustain, so the growth of ore and coal
trade among other large cargoes will shrink further. It is estimated that the
dry bulk cargo throughput of global ports will reach its peak in 2016 after
when the throughput of major ports may witness significant slides.
|


 Back:
Back:
 Next:
Next: